import Tabs from '@theme/Tabs'; import TabItem from '@theme/TabItem';
This chapter presents the software architecture of the Sipmon MBI extension and provides an overview of the integration of the extension with Sipmon monitoring software.
This document is intended for administrators who will install or configure Sipmon MBI.
Four main steps are required to install Sipmon MBI:
- Check the system requirements.
- Install the Sipmon MBI interface in the Sipmon application (Sipmon MBI Server).
- Install the reporting server (Sipmon MBI Reporting Server).
- Configure the extraction, transformation and loading (ETL) in the Sipmon MBI interface.
Architecture
A dedicated reporting server
The architecture and these requirements apply to:
- test
- pre-production
- production environments.
The diagram below highlights the main components of Sipmon MBI:
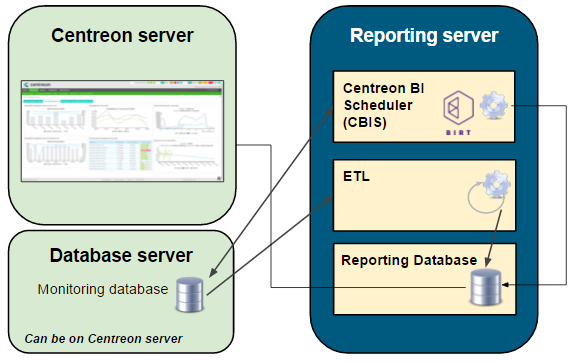
The monitoring database is not necessarily on the same server as the Sipmon server.
- ETL: Process that extracts, transforms and loads data into the reporting database.
- CBIS: The scheduler that manages the execution and publication of reports.
- Reporting Database: The MariaDB database that contains the reporting data and some raw data extracted from the monitoring database.
Network Flow Tables
The table below shows the different types of flows, by default, between the dedicated BI server, the Sipmon server and the databases:
| Application | Source | Destination | Port | Protocol |
|---|---|---|---|---|
| ETL/CBIS | Reporting server | Sipmon database server | 3306 | TCP |
| SSH | Reporting server | Sipmon Server | 22 | TCP |
| CBIS | Reporting server | Sipmon Server | 80 | HTTP* |
| CBIS | Sipmon | Reporting server | 1234 | TCP |
| Widgets | Sipmon central server | Reporting server | 3306 | TCP |
Only required for Host-Graph-v2 and Hostgroup-Graph-v2 reports that use the Sipmon API to generate graphs.
Information about the packages
The Sipmon MBI installation is based on two RPM packages:
- Sipmon-bi-server: Installs the MBI interface integrated with the Sipmon interface. The package is installed on the Sipmon central server.
- Sipmon-bi-reporting-server: Contains all the components needed to run the reporting server (report scheduler, ETL, standard reports). It must be installed on a server dedicated to reporting processes.
The installation of the database must be done at the same time. We strongly recommend installing the MariaDB database on the reporting server for performance & isolation reasons.
Prerequisites
Central Sipmon server
Software requirements
See the software requirements.
You should install the MariaDB database at the same time. We highly recommend installing the database on the same server for performance & isolation considerations.
Description of users, umask and home directory
| User | umask | home |
|---|---|---|
| SipmonBI | 0002 | /home/SipmonBI |
Dedicated reporting server
Hardware layer
To check the free space, use the following command by replacing vg_data with the name of the group volume:
vgdisplay vg_data | grep -i free*Firmware and software layer
- OS : CentOS / Redhat 7 ou 8 / Oracle Linux 8 / Alma 8 / Debian 11
- SGBD : MariaDB 10.5
- Firewalld : Disabled (look here)
- SELinux : Disabled (look here)
Make sure that the time zone of the reporting server is the same as that of the central server, otherwise report publications will fail (link to download missing). The same time zone must be displayed with the
timedatectlcommand. You can change the time zone with this command:shelltimedatectl set-timezone Europe/Paris
Be sure to optimize MariaDB on your reporting server. You will need at least 12GB of RAM in order to use the next file.
Make sure you have a tmp folder in /var/lib/mysql.
Do not set these MariaDB optimizations on your monitoring server.
Users and groups :
| User | Group |
|---|---|
| SipmonBI | SipmonBI |
Description of users, umask and user directory:
| User | umask | home |
|---|---|---|
| SipmonBI | 0002 | /home/SipmonBI |
Install the extension on Sipmon
The actions listed in this chapter must be performed on the Sipmon Central Server.
Install the Business repository, you can find it on the support portal.
Then run the following command:
Enable the extension
The menu Administration > Extension > Manager allows you to install the different extensions detected by Sipmon. Click on the Sipmon MBI tile to install it.
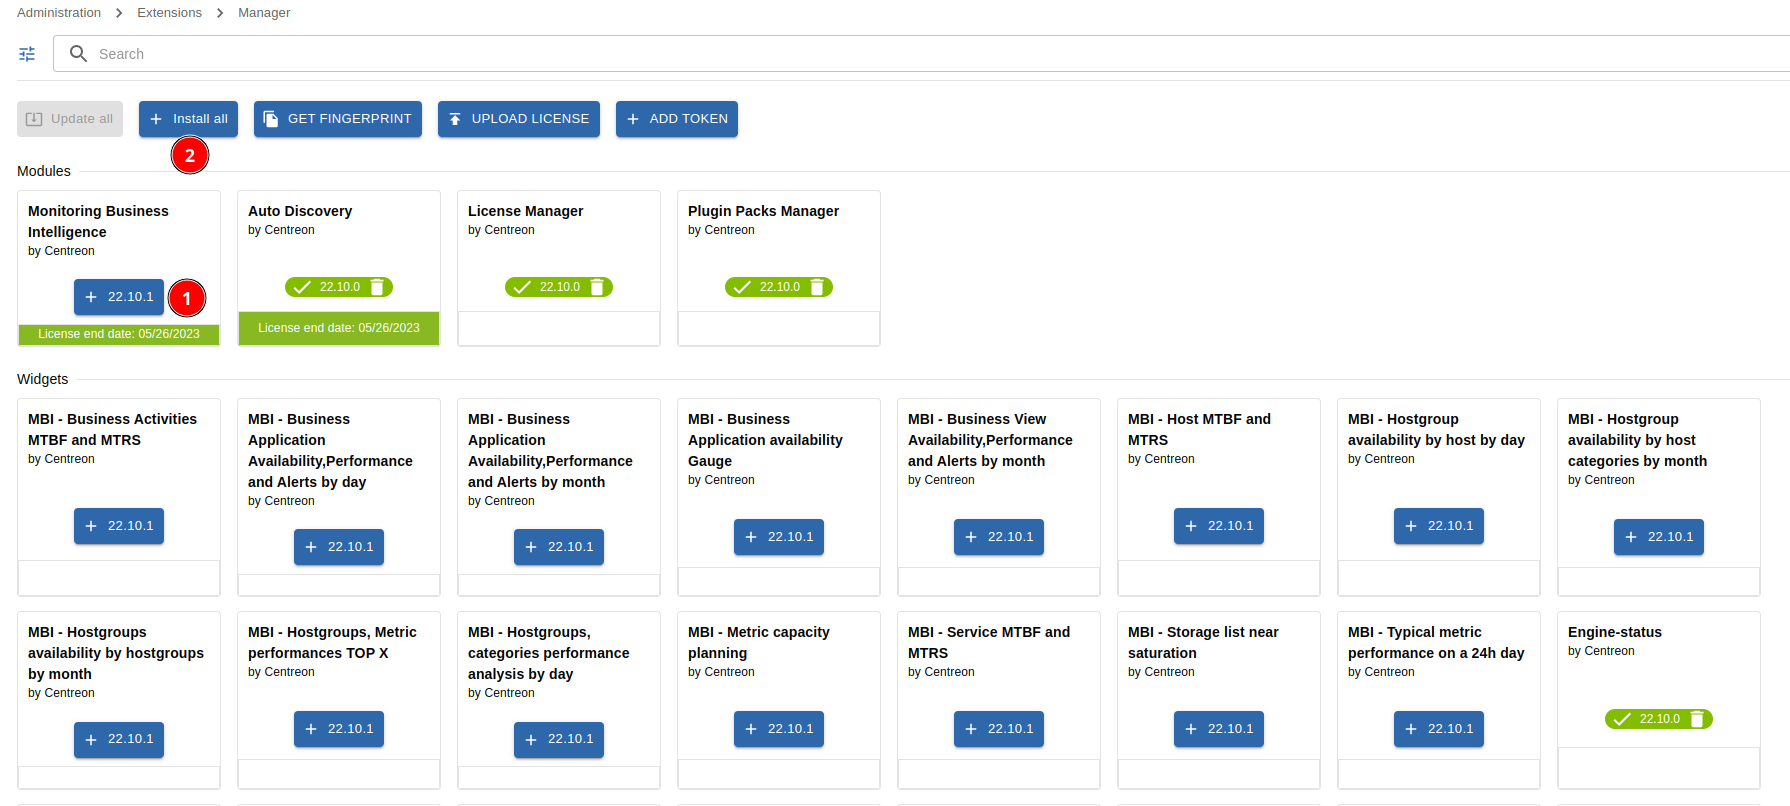
Then, download the license sent by the Sipmon team to start configuring the general options.
Configure the extension
Enter the following values in the Sipmon general options MBI menu, Reports > Monitoring Business Intelligence > General Options :
| Tabs | Option | Value |
|---|---|---|
| Scheduler options | CBIS Host | IP address of the reporting server |
| ETL options A MariaDB database dedicated to reporting has been set up. | Yes | |
| Reporting widgets | Reporting MariaDB database | IP address of the reporting base (default = IP address of the reporting server) |
*The connection test will not work at this point in the installation.
Access to the Central database
Download the license sent by the Sipmon team to start configuring the general options.
If you use MariaDB replication for your monitoring databases, some views are created during the installation of Sipmon MBI. You must exclude them from replication by adding the following line to the my.cnf file of the slave server or mariadb.cnf on Debian 11.
replicate-wild-ignore-table=Sipmon.mod_bi_%v01,Sipmon.mod_bi_%V01Then, create the views manually on the slave server:
Download the following file to a temporary folder (in our example, /tmp), for instance using wget.
Run the following command (change the name of your temporary folder if necessary):
mysql Sipmon < /tmp/view_creation.sqlDebian 11 specific configuration
MariaDB must listen on all interfaces instead of listening on localhost/127.0.0.1 (default value). Edit the following file:
/etc/mysql/mariadb.conf.d/50-server.cnfSet bind-address to 0.0.0.0 and restart mariadb.
systemctl restart mariadbGive rights to the cbis user
When you install Sipmon MBI, a user named cbis is automatically created. It allows the report generation engine to extract data from Sipmon (using the APIs) in order to insert them in the report. This user must have access to all resources monitored by Sipmon in order to extract the performance graphs for the following reports:
- Host-Graph-v2
- Hostgroup-Graph-v2.
To test the connection between the MBI reporting server and the Sipmon API, use the following command to download a graph. Replace the graph parameters and timestamps, and replace XXXXXXXXX with the user's autologin token cbis:
curl -XGET 'https://IP_CENTRAL/Sipmon/include/views/graphs/generateGraphs/generateImage.php?akey=XXXXXXXXX&username=CBIS&hostname=<host_name>&service=<service_description>&start=<start_date>&end=<end_date>' --output /tmp/image.pngExample :
curl -XGET 'https://10.1.1.1/Sipmon/include/views/graphs/generateGraphs/generateImage.php?akey=otmw3n1hu03bvt9e0caphuf50ph8sdthcsk8ofdk&username=CBIS&hostname=my-poller&service=Cpu&start=1623016800&end=1623621600' --output /tmp/image.pngThe result should look like the code below, and the desired graph image must have been uploaded to the /tmp directory:
  % Total    % Received % Xferd  Average Speed   Time    Time     Time  Current
                                 Dload  Upload   Total   Spent    Left  Speed
100 18311  100 18311    0     0  30569      0 --:--:-- --:--:-- --:--:-- 30569
Install the reporting server
Install the packages
You must have the following information before proceeding with the installation process:
IP/DNS of the monitoring database
IP/DNS of the Sipmon web interface
IP/DNS of the reporting database (localhost strongly recommended)
Access (user/password) to the reporting database
Define and retrieve the ssh password of the SipmonBI user, on the Central server (for the availability of the reports generated on the interface)
Procedure
To start installing the reporting server, install the Business repository. You can find it on the support portal.
Ensure a version of Java 17 (or 18) is installed.
- If you need to check the Java version, enter the following command:
shelljava -versionIf you need to upgrade the Java installation to Java 17 (or 18), go to the Oracle official download page.
If several Java versions are installed, you need to activate the right version. Display the installed versions using the following command and select the Java 17 (or 18) version:
shellsudo update-alternatives --config javaThen run the following command:
Enable the cbis service:
systemctl enable cbisStart and enable gorgoned:
systemctl start gorgoned && systemctl enable gorgonedConfigure the reporting server
MariaDB Optimizations
Secure the database
Since MariaDB 10.5, it is mandatory to secure the root access of the database before installing Sipmon. If you use a local database, execute the following command on the central server, otherwise on the database server:
mysql_secure_installation- Answer yes to all questions except "Disallow root login remotely?"
- It is mandatory to define a password for the root user of the database. You will need this password during the web-installation.
For more information, please see the official MariaDB documentation.
Start configuring
Make sure the MariaDB reporting system is started and then run the commands below and answer the commands below and answer the questions:
/usr/share/Sipmon-bi/config/install.shThe script manages the exchange of SSH keys between the monitoring server and the reporting server, and configures the default SFTP publishing rule in order to publish the reports on the Sipmon web interface. Finally, it enables the backup and starts the CBIS service.
Once the installation is complete, continue to the next chapter to configure the ETL.
Problem with the SSH exchange key
In some cases, SSH key exchange fails. To solve the problem, do the following manually:
Switch to the SipmonBI user :
su - SipmonBIGenerate the SSH key :
ssh-keygen -t ed25519 -a 100 -f ~/.ssh/id_ed25519 -P "" -qAnd print the SipmonBI public key (in order to authorize it then on Sipmon) :
cat /home/SipmonBI/.ssh/id_ed25519.pubNow, on the monitoring server :
Create a .ssh folder that SipmonBI will own, restrict permissions on this folder and paste into the authorized_keys file the contents of its public key on the reporting server (shown earlier) :
mkdir -p /home/SipmonBI/.ssh/ && chown SipmonBI: /home/SipmonBI/.ssh/ && chmod 700 /home/SipmonBI/.ssh/ && echo "@reporting pub key content@" > /home/SipmonBI/.ssh/authorized_keysThe key exchange must then be validated by a first connection that will accept the SSH server signature. As the SipmonBI user from the reporting server :
ssh SipmonBI@@MONITORING_SERVER@Then exit the SipmonBI session with exit or Ctrl-D on both servers.
To continue, run the installation script (/usr/share/Sipmon-bi/config/install.sh) as above and answer Yes when asked to proceed with the SSH key exchange. You will get an error when creating the USER, because it already exists. This is not a blocking step.
ETL : Configuration
Sipmon MBI integrates an ETL that allows you to :
- Synchronize the raw data from the monitoring to the reporting server
- Feed statistical data to the reporting server databases statistical data
- Control the retention of data on the reporting server
Before proceeding to the next steps, it is necessary to read the chapter on best practices to make sure that the configuration of the objects in Sipmon (groups, categories...) is in accordance with the expectations of Sipmon MBI.
In the Reporting > Monitoring Business Intelligence > General Options > ETL Options tab, specify the following options the following options:
| Options | Values |
|---|---|
| General options | |
| Reporting engine uses a dedicated dedicated MariaDB server | Yes. You must use a reporting server |
| Temporary file storage directory on reporting server | Folder where dumps will be stored on the reporting server |
| Type of statistics to build | Select “Availability only” if you only use availability reports. Select “Performance and capacity only” if you only want to use capacity and performance reports. Select “All” to calculate the statistics for both types of reports. |
| Use large memory tweaks (store MariaDB temporary tables in memory) | Activated only if your MariaDB configuration and allocated physical memory on the server permits. |
| Reporting perimeter selection | |
| Hostgroups | Select only host groups for which you want to aggregate data. |
| Hostcategories | Select only host categories for which you want to aggregate data. |
| Service categories | Select only service categories for which you want to aggregate data. |
| Availability statistic calculation | |
| Live services for availability statistics calculation | Select required time periods. |
| Performance and capacity statistic calculation | |
| Granularity required for performance data statistics | Select the level of granularity required to run the desired performance reports (1). |
| Live services for performance data statistics calculation | Select the required time periods. |
| Capacity statistic aggregated by month | |
| Live services for capacity statistics calculation | Select the “24x7” time period. |
| Service categories related to capacity data monitoring | Select the service categories that have been associated with capacity-type services. |
| Exclude metrics from service categories that do not return capacity USAGE information | Concerns the metrics linked to services which return capacity data. Select the metrics that do not return capacity usage information. but a maximum or total value. (e.g., the metric “size”). |
| Centile parameters | |
| Calculating centile aggregation by | Select the desired aggregation level. The standard percentile report provided with BI 2.1 uses Month data. |
| Select service categories to aggregate centile on | Filter on relevant service categories for centile statistics (e.g., Traffic). |
| First day of the week | Select the first day of the week for Week aggregation. |
| Centile / Timeperiod combination | Create a new centile/timeperiod combination on which to perform the calculation. |
(1) Reports requiring data granularity by the hour are listed below. If you do not wish to use these reports, disable the calculation of hourly statistics:
Hostgroup-Host-details-1
Host-detail-v2
Hostgroup-traffic-Average-Usage-By-Interface
Hostgroup-traffic-by-Interface-And-Bandwith-Ranges
ETL: Data retention
The reporting server contains tables of statistics specific to Sipmon MBI in the "Sipmon_storage" database. The storage space used by these tables is increasing every day. It is possible to control the size of these tables by defining data retention rules.
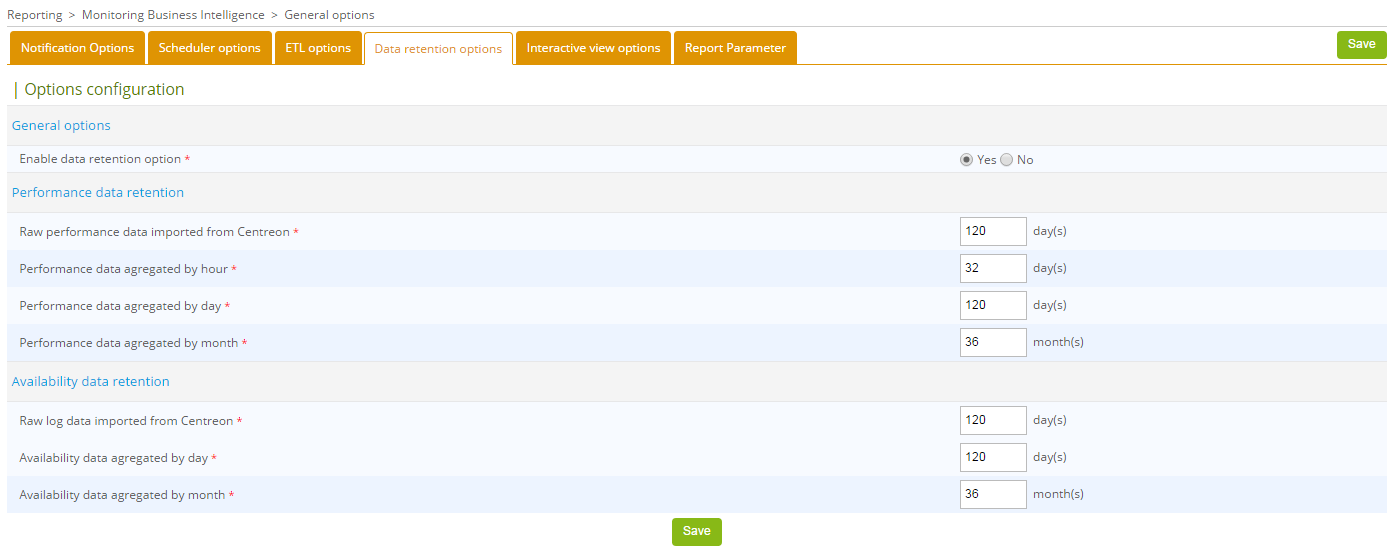
Under Reports > Monitoring Business Intelligence > General Options > Data Retention Options menu, data retention can be managed by :
- Type of data (availability, performance).
- Data granularity (raw data, hourly, daily or monthly values)
Before enabling the data retention options, make sure that the reporting engine uses a dedicated MariaDB server, and the corresponding option is set to Yes in the menu Reporting > Business Intelligence > General Options ETL Options.
Enable data retention management by selecting Yes, then set the configuration options (example below).
To enable automatic purging of old data, edit the cron file /etc/cron.d/Sipmon-bi-purge on the reporting server, then uncomment the following line:
#0 20 * * * root @Sipmon_BI_HOME@/*etl*/dataRetentionManager.pl >> @Sipmon_BI_LOG@/dataRetentionManager.log 2>&1Avoid scheduled periods for statistical calculations with Sipmon MBI ETL and report generation. You can run this cron daily or weekly, depending on the batch execution time and the load generated on the server.
BEST PRACTICES : Select different retention periods depending on the granularity of the statistical data:
Aggregated values per hour are used to analyze a metric over a short period of time, they take up a lot of disk space. You may not need to keep these statistics for more than two or three months.
Beyond five or six months, you may only need to view the trend for availability or performance statistics. You could then retain daily aggregate data for up to six months, for example, and set up retention of monthly aggregate data for a period of several dozen months.
Please proceed to the next section to continue the installation.
ETL : Execution
Before continuing, make sure you have installed the MariaDB configuration file as described above in the prerequisites. Configure and enable data retention so that only the required data is imported and calculated.
Reconstruction of statistics from historical data
Run the following command on the reporting server. This will:
- Delete all existing data from the reporting server.
- Import raw monitoring data from the monitoring server to the reporting server (depending on retention settings).
- Fill tables containing availability statistics for hosts and services.
- Fill in tables containing performance and capacity statistics for hosts and services.
/usr/share/Sipmon-bi/bin/SipmonBIETL -rEnable daily script execution
Once the data rebuilding process is complete, you can enable the calculation of statistics. On the reporting server, edit the file /etc/cron.d/Sipmon-bi-engine and uncomment the following line:
#30 4 * * * root /usr/share/Sipmon-bi/bin/SipmonBIETL -d >> /var/log/Sipmon-bi/SipmonBIETL.log 2>&1Make sure that the SipmonBIETL batch only starts after the eventReportBuilder batch has finished on the monitoring server (check the /etc/cron.d/Sipmon cron file on the monitoring server).
The installation of Sipmon MBI is now complete, see the tutorial.