SIPmon Root Cause Analyzer
Introduction
What is Root Cause Analysis?
Root Cause Analysis is a systematic process of identifying the fundamental causes of problems or events in your system. Rather than addressing symptoms, RCA helps you discover the underlying issues that lead to anomalies, performance degradation, or failures.
Why Use SIPmon RCA?
Traditional troubleshooting can be time-consuming and requires manual correlation of multiple metrics and logs. SIPmon RCA automates this process by:
- Analyzing patterns across multiple data sources simultaneously
- Correlating temporal relationships between different metrics
- Providing confidence-rated hypotheses based on evidence
- Reducing mean time to resolution (MTTR)
- Offering structured action plans for remediation
How SIPmon RCA Works
The RCA module uses advanced algorithms to:
- Collect metrics and traces from your selected application
- Detect anomalies and unusual patterns in the specified time range
- Search for and identify previous similar incidents in historical data
- Correlate multiple signals to identify potential root causes
- Generate hypotheses with confidence levels (typically 70%+)
- Classify issues by severity (high, medium, low)
- Provide categorized remediation actions
- Display visual representations of system relationships
- Enable interactive exploration through AI-powered chat
How to Use
Accessing the Root Cause Analyzer
- Navigate to Monitoring in the main menu
- Click on Root Cause Analysis
- Select the RCA Overview tab
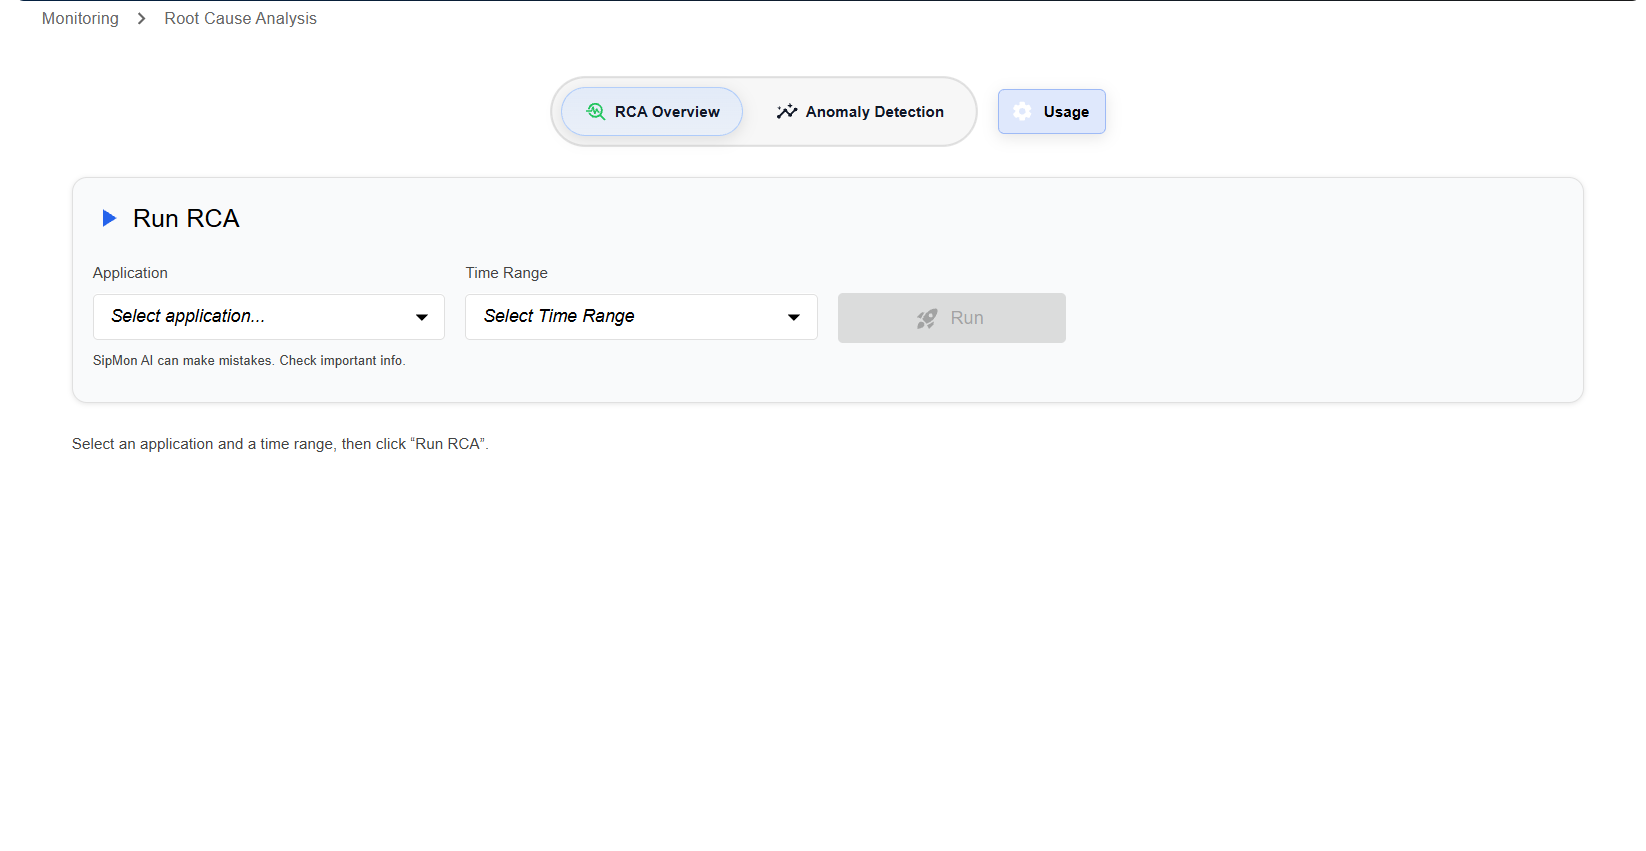 Figure: Root Cause Analysis Initial Dashboard View
Running an RCA Analysis
Step 1: Select an Application
- Click on the Application dropdown menu
- Browse or search for your application
- Select the application you want to analyze
Note: Ensure you have the appropriate permissions to access the selected application's metrics.
 Figure: Root Cause Analysis Select an Application View
Step 2: Choose a Time Range
- Click on the Time Range dropdown menu
- Select from preset time ranges, or define a custom range
- Consider selecting a time range that:
- Includes the period when issues were observed
- Provides sufficient context (typically 15-60 minutes)
- Covers both normal and anomalous behavior for comparison
 Figure: Root Cause Analysis Select Time Range
Tip: For transient issues, narrow the time range to focus on the specific incident window.
Step 3: Run the Analysis
- Click the Run button (rocket icon)
- Wait for the analysis to complete (typically 10-30 seconds)
- Review the generated results
 Figure: Root Cause Analysis Run the Analysis
Important: SIPMon AI can make mistakes. Always verify important findings with additional investigation.
Understanding the Results
Once the analysis completes, you'll see several main sections:
1. Hypotheses Tab
This tab displays potential root causes ranked by confidence level.
What You'll See:
- Hypothesis ID (e.g., HYP-1, HYP-2)
- Title: Brief description of the potential root cause
- Confidence Level: Indicates how certain the system is about this hypothesis
- Accepted (green): High confidence (typically 70%+)
- Inconclusive (gray): Moderate confidence, requires further investigation
- Description: Detailed explanation of the hypothesis
- Supporting Evidence: Specific observations that support this hypothesis
Example: 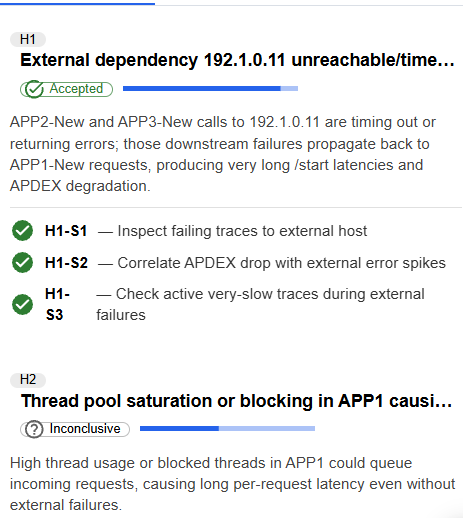 Figure: Root Cause Hypotheses tab View
How to Use:
- Start with accepted hypotheses as they have the highest likelihood
- Review the evidence to validate the hypothesis
- Use the raw data links to drill deeper into specific metrics
2. Issues Tab
This tab lists specific issues detected during the analysis period.
What You'll See:
- Issue ID (e.g., ISSUE-1, ISSUE-2, ISSUE-3)
- Title: Brief description of the issue
- Severity Badge:
- High (red): Critical issues requiring immediate attention
- Medium (orange): Moderate issues that should be addressed soon
- Low (green): Minor issues or informational alerts
- Description: Detailed explanation including affected metrics and values
Example: 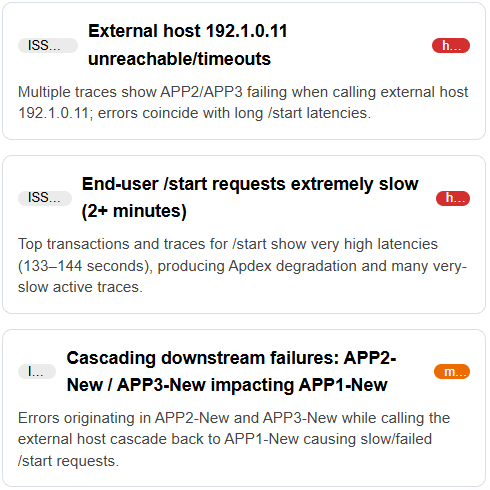 Figure: Root Cause Issues tab View
How to Use:
- Prioritize high-severity issues first
- Compare issue timestamps with known events or deployments
- Cross-reference with hypotheses to understand root causes
3. Evidence / Downstream Tab
This tab provides supporting evidence and downstream impacts.
What You'll See:
- Metric details (names, timestamps, values)
- Anomaly scores indicating deviation from normal behavior
- Correlation information between different metrics
- Visual indicators showing relationships
Example: Figure: Evidence / Downstream Tab View
How to Use:
- Use evidence to validate hypotheses
- Identify patterns across multiple metrics
- Understand the scope and impact of issues
4. Actions Sections
The RCA provides four categories of recommended actions:
 Figure: Actions Sections Tab View
Immediate Actions
Actions to take right now to stabilize the system or gather critical information.
Examples:
- Check current CPU usage on affected instances
- Review recent deployments or configuration changes
- Collect thread dumps if CPU is still elevated
Short-term Actions
Actions to implement within hours or days to address the immediate problem.
Examples:
- Adjust Prometheus scrape intervals
- Increase resource allocations
- Implement rate limiting
Long-term Actions
Strategic changes to prevent recurrence and improve system resilience.
Examples:
- Optimize application performance
- Implement better monitoring and alerting
- Review and update capacity planning
Verification Steps
Steps to confirm that the issue is resolved and monitor for recurrence.
Examples:
- Monitor CPU metrics for 24-48 hours
- Verify scrape frequency has decreased
- Check correlation between CPU and scrape events has weakened
How to Use Actions:
- Expand each action category by clicking on it
- Review all recommended actions
- Prioritize based on your operational needs
- Document actions taken for future reference
- Use verification steps to confirm resolution
Detecting Previous Incidents
The RCA automatically detects and displays previous incidents related to the current analysis, helping you identify patterns and recurring issues.
What You'll See:
- A list of historical incidents with similar characteristics
- Timestamps of when previous incidents occurred
- Severity and issue types from past incidents
- Links to view details of previous RCA results
How to Use:
- After running an RCA, look for the "Previous Incidents" section
- Review the list of detected historical incidents
- Click on any previous incident to view its full RCA results
- Compare patterns between current and previous incidents
- Identify if this is a recurring issue or a new problem
Benefits:
- Pattern Recognition: Identify if similar issues have occurred before
- Trend Analysis: Understand if problems are increasing in frequency
- Solution Reference: Review what actions were taken in previous incidents
- Root Cause Validation: Confirm if the same root cause appears repeatedly
- Prevention Planning: Use historical data to implement long-term fixes
Example Use Case: If the current RCA shows a CPU spike, previous incidents might reveal:
- Similar CPU spikes occurred every Tuesday at 2 PM (suggesting scheduled job)
- The issue started after a specific deployment date
- Previous mitigations that worked or didn't work
Using the Interactive Chat
The RCA includes an AI-powered chat interface where you can ask questions about the analysis results and get instant clarifications.
Accessing the Chat:
- Look for the chat box interface (typically at the bottom or side of the RCA results)
- Click on the chat input field to start typing
- Enter your question and press Enter or click Send
What You Can Ask:
- Clarification Questions: "What does hypothesis HYP-1 mean in simple terms?"
- Evidence Details: "Show me more details about the CPU spike at 11:20 AM"
- Action Guidance: "Which action should I prioritize first?"
- Comparison Questions: "How is this different from the incident last week?"
- Technical Queries: "What is the anomaly score threshold?"
- Next Steps: "What should I check next?"
Example Chat Interactions:  Figure: Chat View
Best Practices for Using Chat:
- Be Specific: Ask about particular hypotheses, issues, or metrics
- Reference IDs: Use hypothesis IDs (HYP-1) or issue IDs (ISSUE-1) for clarity
- Ask Follow-ups: Build on previous questions to dig deeper
- Request Examples: Ask for concrete examples or scenarios
- Verify Understanding: Rephrase the AI's explanation to confirm comprehension
Chat Limitations:
- The chat is context-aware of the current RCA results only
- It cannot execute actions or make changes to your system
- Always verify critical information with actual metric data
- The AI may not have information beyond what's in the RCA results
How to Use Actions:
- Expand each action category by clicking on it
- Review all recommended actions
- Prioritize based on your operational needs
- Document actions taken for future reference
- Use verification steps to confirm resolution
Viewing the RCA Context Diagram
The visual diagram shows relationships between different components and hypotheses.
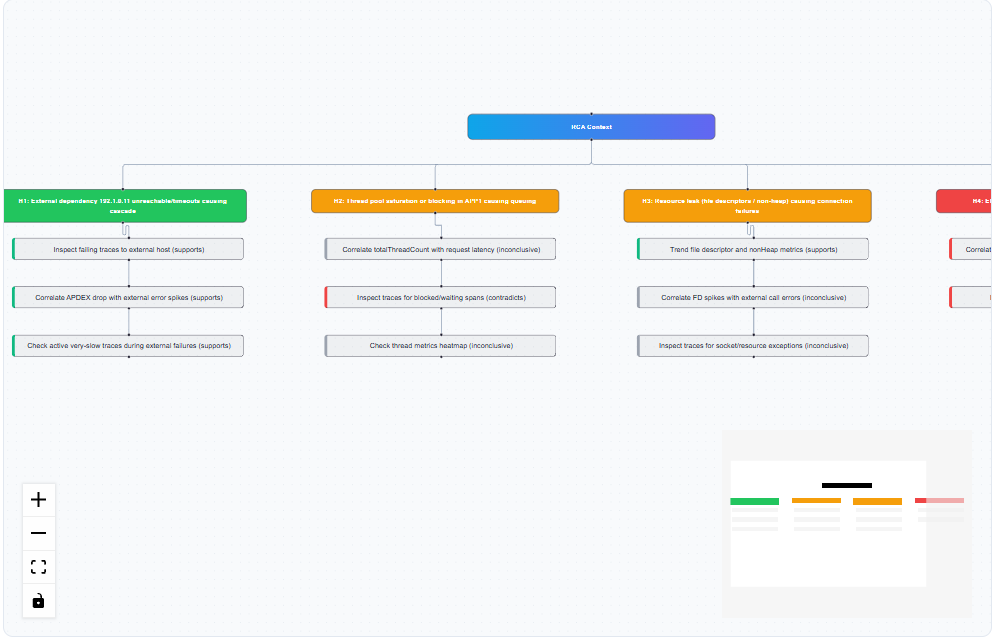 Figure: RCA Context Diagram
Features:
- Color-coded nodes representing different hypothesis categories
- Connecting lines showing relationships and dependencies
- Minimap for navigation in complex diagrams
- Zoom controls (+, -, fullscreen, download)
How to Use:
- Click + to zoom in, - to zoom out
- Use the minimap (bottom right) to navigate large diagrams
- Click nodes to highlight related components
- Download the diagram for documentation or sharing
Best Practices
Before Running RCA:
- Ensure you have a clear understanding of when the issue occurred
- Select an appropriate time range that captures the anomaly
- Have relevant context about recent changes or deployments
When Analyzing Results:
- Don't rely solely on the highest confidence hypothesis
- Review multiple hypotheses to get a complete picture
- Cross-reference issues with your own observations
- Validate findings with actual metric data
- Check previous incidents for patterns and recurring issues
- Use the chat feature to clarify unclear points
After RCA:
- Document your findings and actions taken
- Share insights with your team
- Implement recommended actions systematically
- Use verification steps to confirm resolution
- Compare with previous incidents to identify trends
For Recurring Issues:
- Compare RCA results across multiple incidents
- Look for common patterns in hypotheses
- Prioritize long-term actions to prevent recurrence
- Review previous incidents to see what solutions worked
- Use the chat to ask about differences between incidents
Using the Chat Effectively:
- Ask specific questions about hypotheses or issues
- Request clarification on technical terms or metrics
- Inquire about recommended next steps
- Compare current and previous incidents
- Validate your understanding before taking action