SIPMon Reporting
Dashboard Overview
The Availability Reports feature within the SIPMon Reporting module offers a comprehensive view of monitored objects. It allows users to visualize availability rates for hosts, host groups, or service groups over a custom-defined period directly from the web interface.
Accessing Availability Reports
To access the availability reports, follow these steps:
- Navigate to the menu Reporting → Dashboard.
- In the left-hand menu, click on Hosts.
- Select the desired host from the Hosts List.
 Figure: Reporting Dashboard View
Key Features
- Reporting Period: Select a predefined time period or define a manual range using "From" and "To" fields.
- Host State Table: Displays the availability rates of the selected objects.
- State Breakdowns: Shows the detailed availability of linked services for the host.
- Timeline: Provides an intuitive visual representation of object status over time.
- Drill-down: Clicking on a specific day in the timeline generates a detailed report for that day.
Event Logs
The Event Logs section allows users to view historical data and events for monitored resources.
Viewing Event Logs
To view event logs, go to the menu Monitoring → Event Logs.
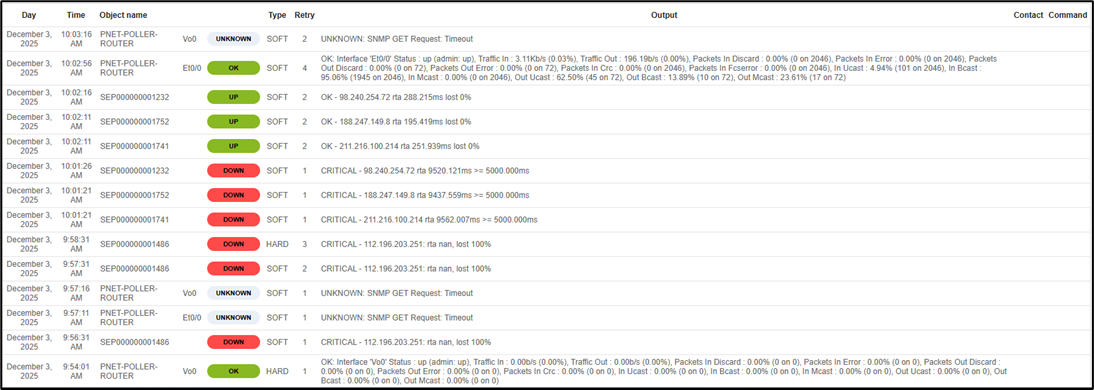 Figure: Event Logs Interface
Filtering & Selection
- Object Selection: Use the upper menu to select specific hosts or services. You can also filter by Service Group or Host Group.
- Search Filters: Utilize the Message Type and Status Field to refine the search for specific event types.
- Log Period: Select a time period for the logs. Use the drop-down for generic periods or manually define the timeframe using the date fields.
Log Results
The results table provides detailed information about each logged event. Below is a description of the available columns:
| Column Name | Description |
|---|---|
| Day | Shows the date of the log entry. |
| Time | Shows the timestamp of the log entry. |
| Object Name | Displays the name of the Host and/or Service. |
| Status | Indicates the status of the object at that time. |
| Type | Shows the object state type – SOFT or HARD. |
| Retry | Displays the number of retries attempted since the status change. |
| Output | Shows the system output or message for the Host or Service. |
| Contact | Lists the contact person (displayed only for notifications). |
| Command | Shows the notification command used (displayed only for notifications). |