Initial Login and Dashboard Overview
Accessing the SIPMon Web Interface
To access your SIPMon web interface, navigate to the following URL in your web browser:
http://IP_ADDRESS/SipmonNote: Replace IP_ADDRESS with the actual IP address, hostname, or fully qualified domain name (FQDN) of your SIPMon web server. For secure connections, use https:// if SSL has been configured on your server.
The login page appears as shown below:
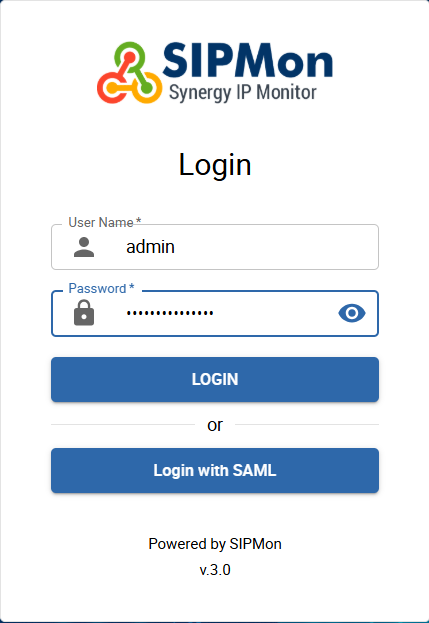
Figure 1: SIPMon Login Page
Login Procedure
- Enter your username and password in the designated fields on the login form
- Click the Connect button to authenticate
- Upon successful authentication, you will be redirected to the SIPMon dashboard, which displays system status, active alarms, and available reports
Dashboard Overview
The main dashboard interface is displayed below:
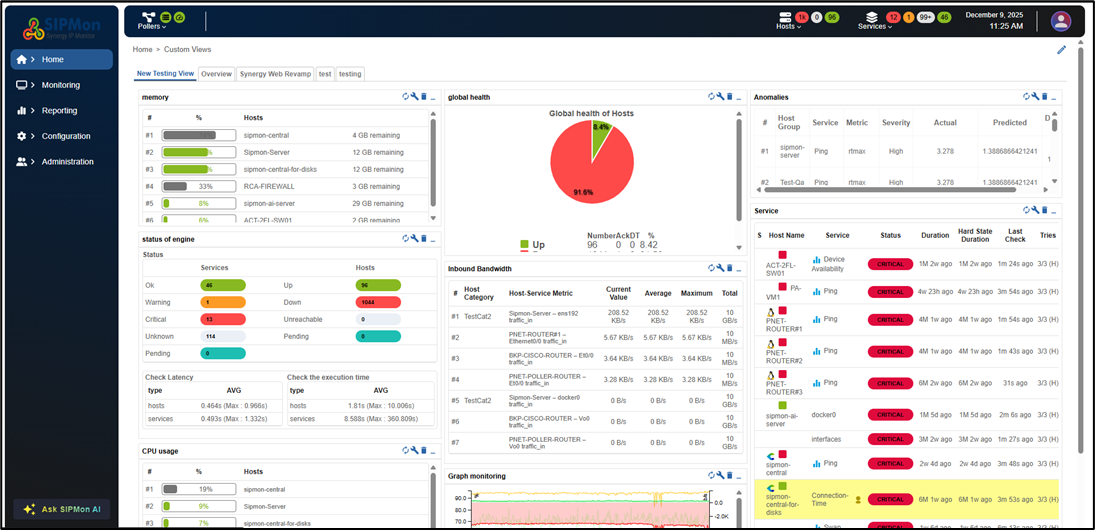
Figure 2: SIPMon Main Dashboard
Dashboard Components
The main dashboard consists of the following key elements:
1. Supervision Satellite Status View
A synthesized overview displaying the operational state of all supervision satellites.

Figure 3: Supervision Satellite Status Overview
2. Host Status Bar
A consolidated status indicator providing an at-a-glance view of all supervised hosts.

Figure 4: Host Status Bar
3. Service Status Bar
A comprehensive status indicator displaying the current state of all supervised services.

Figure 5: Service Status Bar
4. Primary Navigation Menu
The main navigation menu provides access to core system functions and features.

Figure 6: Primary Navigation Menu
5. Secondary Navigation Submenu
Context-sensitive submenu providing access to related interfaces and detailed views.

Figure 7: Secondary Navigation Submenu
6. Interface-Specific Navigation
Dedicated navigation menu for individual interface contexts and detailed operations.

Figure 8: Interface-Specific Navigation
Home Interface
The Home menu provides two distinct view types for comprehensive system monitoring:
- Custom View - Tailored dashboards for individual services and components
- Performance View - Real-time monitoring of engine processes and performance metrics controlled by SIPMon

Figure 9: Home Interface Custom View Menu