SIPMon NetFlow Analyzer - User Manual
Table of Contents
- Overview
- Key Features
- Getting Started
- Dashboard (Landing Page)
- Detail Views
- List Views
- Time Period Selection
- Filtering and Searching
- Data Refresh
- Navigation Guide
- Understanding the Data
- Tips and Best Practices
Overview
SIPMon NetFlow Analyzer is a comprehensive network traffic analysis module integrated into SIPMON. It provides real-time and historical visibility into network flows, helping you understand network behavior, identify top talkers, detect anomalies, and troubleshoot network issues.
What is NetFlow?
NetFlow is a network protocol developed by Cisco for collecting IP traffic information. The SIPMon NetFlow Analyzer captures, processes, and analyzes NetFlow data from your network devices (routers, switches, firewalls) to provide actionable insights into network traffic patterns.
Key Features
📊 Real-Time Monitoring
- Live Dashboard: Real-time view of network traffic with auto-refresh
- Multiple Time Ranges: From 5 minutes to 5 years of historical data
- Auto-Refresh: Configurable automatic data refresh (1, 5, or 10 minutes)
🔍 Traffic Analysis
- Top Conversations: Identify the busiest communication pairs in your network
- Top Endpoints: See which IP addresses generate the most traffic
- Top Applications: Understand which protocols and services dominate bandwidth
- Geographic Distribution: Visualize traffic by country with flags and ASN info
📈 Visualization
- Interactive Charts: Time series, pie charts, and bar charts
- Responsive Tables: Sortable, filterable data tables with pagination
- Traffic Badges: Color-coded traffic volume indicators (MB, GB, TB, PB)
- Drill-Down Navigation: Click any entity to view detailed analysis
🎯 Detailed Views
- Application Analysis: Deep dive into specific applications (HTTP, SSH, DNS, etc.)
- Conversation Details: Bidirectional traffic analysis between two endpoints
- Endpoint Analysis: Complete profile of any IP address's network activity
- Device & Interface Views: NetFlow source device and interface statistics
🔎 Advanced Filtering
- Search: Find specific IPs, applications, or countries
- Multi-Filter: Combine filters (endpoint, protocol, country, application)
- Threshold Filters: Filter by minimum traffic or flow count
- Sampler Filters: Scope analysis to specific NetFlow sources
🌐 Enrichment
- Hostname Resolution: Automatic lookup from SIPMon database
- Country Identification: Geographic location with flag icons
- ASN Information: Autonomous System Number details
- Service Naming: Human-readable service names (HTTPS vs tcp/443)
Getting Started
Accessing the Module
- Log into SIPMon using your credentials
- Navigate to Monitoring in the top menu
- Click on NetFlow Analyzer (typically position #7 in the menu)
- The dashboard will load showing the default 5-minute view
Initial Dashboard View
Upon first access, you'll see:
- Global Summary card with network-wide statistics
- Top Conversations showing the busiest communication pairs
- Top Endpoints displaying the most active IP addresses
- Top Applications listing dominant protocols and services
- NetFlow Sources showing your configured collectors
- Recent Events displaying network anomalies (last hour)
 Figure: NetFlow Analyzer Initial Dashboard View
Understanding the Interface
The interface is divided into:
- Top Bar: Period selector and refresh controls
- Main Content: Three-column responsive layout with cards
- Interactive Elements: Clickable IPs, applications, and countries
- Navigation: Breadcrumbs and back buttons for easy navigation
Global Summary Card
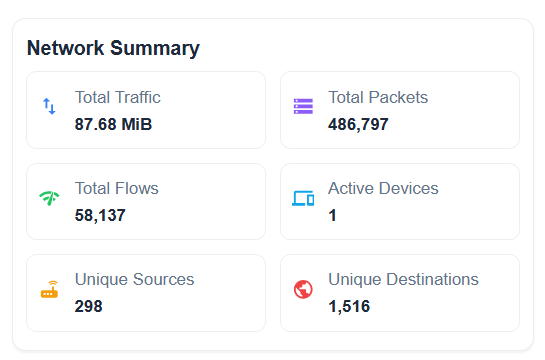 Figure: NetFlow Analyzer Global Summary Card
Location: Top-left card
Displays:
- Total Traffic: Cumulative bytes transferred in selected period
- Total Packets: Number of packets transmitted
- Total Flows: Number of NetFlow records (conversations)
- Active Devices: Count of unique devices seen
- Unique Sources: Number of distinct source IP addresses
- Unique Destinations: Number of distinct destination IPs
Usage:
- Quick health check of network activity
- Identify unusual spikes in traffic or flows
- Compare current vs historical periods
Example:
Total Traffic: 1.23 TB
Total Packets: 45.2M
Total Flows: 892K
Active Devices: 234
Unique Sources: 1,567
Unique Destinations: 12,345
Top Conversations Card

Figure: NetFlow Analyzer Top Conversations Card
Location: Left column, below Global Summary
Purpose: Shows the most active communication pairs (source ↔ destination)
Columns:
- Endpoint A: Source IP (with hostname if available)
- Endpoint B: Destination IP (with hostname if available)
- Country A: Source country with flag
- Country B: Destination country with flag
- Total Traffic: Combined bidirectional traffic
- Flows: Number of flow records
- Top Services: Most used protocols/ports
How to Use:
- Review the list to identify heavy conversations
- Click any IP address to view endpoint details
- Click on a row to view conversation details
- Use country flags to identify international traffic
- Check "Top Services" to understand what protocols are being used
Interaction:
- Click IP Address: Navigate to Endpoint Detail page
- Click Row: Navigate to Conversation Detail page
- Hover: See additional information (ASN, full hostname)
Example Row:
192.168.1.100 (mail-server) ↔ 203.0.113.50 (external-api)
Sri Lanka (LK) → United States (US)
Traffic: 45.2 GB | Flows: 12,543 | Services: HTTPS, SSH
Top Endpoints Card
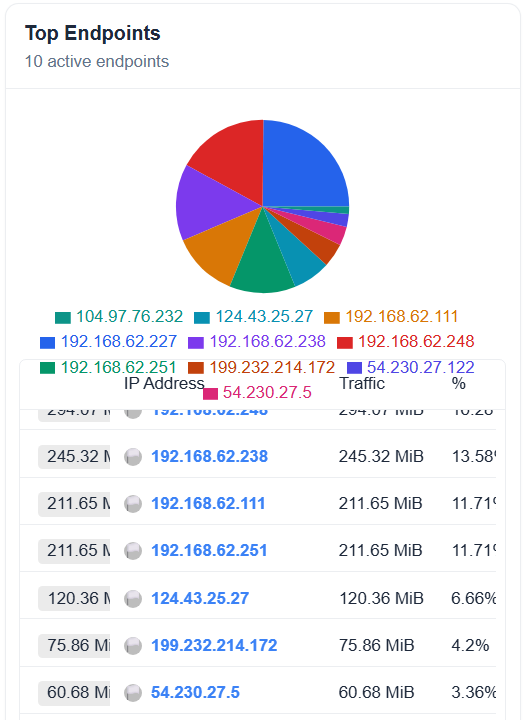
Figure: NetFlow Analyzer Top Endpoints CardLocation: Middle column, top
Purpose: Identifies the busiest individual IP addresses
Columns:
- Endpoint: IP address with hostname
- Country: Geographic location
- Role: Primary role (Source, Destination, or Both)
- Total Traffic: Sum of sent + received traffic
- Conversations: Number of unique peers
- Flows: Total flow records
How to Use:
- Identify bandwidth consumers
- Locate potential bandwidth hogs
- Verify expected server traffic patterns
- Detect anomalous endpoint behavior
Role Indicators:
- 🔴 Source: Primarily sends traffic (e.g., backup server)
- 🔵 Destination: Primarily receives traffic (e.g., web server)
- 🟣 Both: Balanced bidirectional traffic
Clicking Behaviors:
- Click Endpoint: View complete endpoint analysis
- Click Country: Filter to that country (future feature)
Top Applications Card

Figure: NetFlow Analyzer Top Applications Card
Location: Middle column, below Top Endpoints
Purpose: Shows which protocols and services dominate bandwidth
Columns:
- Application: Service name or protocol/port
- Port: Destination port number
- Service Description: Human-readable service name
- Total Traffic: Bandwidth consumed
- Flows: Number of flow records
- Unique Clients: Count of source IPs
- Unique Servers: Count of destination IPs
How to Use:
- Understand network usage patterns
- Identify unauthorized or unexpected protocols
- Validate QoS policies
- Capacity planning for specific services
Application Naming:
- Well-Known Services: Display as service name (HTTPS, SSH, DNS)
- Unknown Ports: Display as protocol/port (tcp/8080, udp/5060)
- Ephemeral Ports: Grouped as "TCP (Ephemeral Ports)" or "UDP (Ephemeral Ports)"
Example:
HTTPS (TCP/443) - Secure Web Traffic
Traffic: 456 GB | Flows: 789K | Clients: 234 | Servers: 45
Clicking Behaviors:
- Click Application: View application detail page with charts and analysis
NetFlow Sources Card

Figure: NetFlow Analyzer NetFlow Sources Card
Location: Right column, top
Purpose: Monitors health and status of NetFlow collectors
Displays:
- Sampler Address: IP of the NetFlow exporter device
- Hostname: Device name
- Interfaces: Expandable list of monitored interfaces
- Last Seen: Timestamp of most recent flow
- Total Traffic: Traffic volume from this source
- Status: Active (green) or Inactive (red) indicator
How to Use:
- Verify all expected devices are reporting
- Identify devices with stale data
- Troubleshoot NetFlow collection issues
- Expand to see per-interface statistics
Interface Details (when expanded):
- Interface ID (in_if / out_if)
- Traffic volume per interface
- Last activity timestamp
Status Indicators:
- ✅ Active: Flows received in last 30 minutes
- ⚠️ Stale: Last flow older than 30 minutes
- ❌ Inactive: No flows in current period
Recent Events Card

Figure: NetFlow Analyzer Recent Events Card
Location: Right column, bottom
Purpose: Displays network anomalies and security events
Columns:
- Time: Timestamp of event
- Event Type: Category (DDoS, Port Scan, Anomaly, etc.)
- Severity: Critical, High, Medium, Low
- Source: Originating IP
- Destination: Target IP
- Description: Event details
How to Use:
- Monitor for security incidents
- Identify attack patterns
- Track suspicious behavior
- Respond to alerts
Severity Levels:
- 🔴 Critical: Immediate action required
- 🟠 High: Attention needed soon
- 🟡 Medium: Monitor and investigate
- 🟢 Low: Informational
Note: This card always shows the last 1 hour of events, regardless of the selected time period.
Detail Views
Application Detail Page
Access: Click any application from Top Applications card
URL Format: ?page=app&app=HTTPS&period=last_6_hours
What You'll See:
Overview Statistics (top section):
- Total traffic (sent + received)
- Total packets and flows
- Average bytes per flow
- Average packet size
- Unique clients and servers
- First seen / Last seen timestamps
- Duration of observation
- Average throughput (bytes/sec, flows/sec)
Geographic Analysis:
- Client countries (sources connecting to this service)
- Server countries (destinations offering this service)
- Country distribution chart
Tabbed Sections:
Top Servers Tab:
- Servers (destinations) providing this service
- Traffic volume per server
- Number of clients connecting
- Geographic location (country, ASN)
- Click to view endpoint details
Top Clients Tab:
- Clients (sources) using this service
- Traffic consumed per client
- Number of servers accessed
- Geographic location
- Click to view endpoint details
Port Variants Tab:
- Different port numbers used for this protocol
- Traffic distribution across ports
- Standard vs non-standard ports
- Useful for identifying misconfigurations
Time Series Tab:
- Traffic over time chart
- Flow count over time
- Identify peak usage times
- Spot unusual traffic patterns
Recent Flows Tab:
- Latest 100 flow records
- Source → Destination details
- Bytes, packets, duration
- TCP flags (if applicable)
- Real-time activity monitoring
Use Cases:
- Analyze HTTP/HTTPS web traffic patterns
- Monitor database connections (MySQL/PostgreSQL)
- Track SSH administrative access
- Identify DNS query patterns
- Troubleshoot application performance
Example Workflow:
- Select "Last 24 Hours" period
- Click on "HTTPS" application
- Review overview statistics
- Switch to "Top Servers" tab
- Identify heaviest web servers
- Click server IP to drill down further
Conversation Detail Page
Access: Click any conversation row from Top Conversations
URL Format: ?page=conversation&src=192.168.1.100&dst=203.0.113.50&period=last_6_hours
What You'll See:
Conversation Overview (header):
- Endpoint A ↔ Endpoint B with hostnames
- Countries and ASN information
- Traffic direction visualization
- Conversation hash (unique identifier)
Bidirectional Statistics:
- A → B Traffic: Bytes and packets from A to B
- B → A Traffic: Bytes and packets from B to A
- Total Traffic: Combined bidirectional
- Traffic Balance: Ratio of A→B vs B→A
- Duration: First seen to last seen
- Average Throughput: Bytes per second
Protocol Analysis:
- Protocols used in this conversation
- Port numbers and services
- Protocol distribution chart
- TCP vs UDP vs ICMP breakdown
Time Series Chart:
- Traffic over time (both directions)
- Separate lines for A→B and B→A
- Flow count over time
- Identify communication patterns
TCP Flags Analysis (if TCP):
- SYN, ACK, FIN, RST, PSH, URG counts
- Connection establishment patterns
- Abnormal flag combinations
- Potential connection issues
Flow Duration Distribution:
- Short flows (< 1 sec)
- Medium flows (1-60 sec)
- Long flows (> 60 sec)
- Persistent connections
- Helps identify session types
Recent Flows Table:
- Last 100 individual flows
- Timestamps, bytes, packets
- Service/port used
- TCP flags
- Flow duration
Use Cases:
- Troubleshoot connectivity issues between two hosts
- Analyze client-server communication patterns
- Verify expected traffic volumes
- Detect potential data exfiltration
- Monitor backup or replication traffic
Example Scenario:
Database Server (192.168.1.50) ↔ Application Server (192.168.1.100)

Overview:
- Total Traffic: 125 GB (Last 24 Hours)
- A → B: 2.3 GB (queries)
- B → A: 122.7 GB (results)
- Protocols: MySQL (tcp/3306), SSH (tcp/22)
- Duration: 23h 45m

Observations:
- Heavy read-only database workload
- Consistent throughput (~1.4 MB/s)
- No connection errors (normal TCP flags)
Endpoint Detail Page
Access: Click any IP address from any card or table
URL Format: ?page=endpoint&ip=192.168.1.100&period=last_6_hours
What You'll See:
Endpoint Profile (header):
- IP address and hostname
- Country and ASN
- Organization name
- First/last seen in network
Traffic Summary:
- Sent: Traffic originated from this endpoint
- Received: Traffic destined to this endpoint
- Total: Combined traffic
- Sent/Received Ratio: Traffic pattern indicator
- Average Packet Size: Helps identify traffic type
- Total Packets: Packet count
- Total Flows: Flow record count
Behavioral Analysis:
- Unique Peers: Number of hosts communicated with
- Duration: Time span of activity
- Throughput: Average bytes per second
- Role: Primarily a client, server, or both
Tabbed Sections:
Top Peers Tab:
- Other endpoints this IP communicates with most
- Traffic volume per peer
- Direction (inbound/outbound/both)
- Services used with each peer
- Click to view conversation details
Protocols Tab:
- Protocol distribution (TCP, UDP, ICMP, etc.)
- Pie chart visualization
- Traffic percentage per protocol
- Flow count per protocol
Services (as Client) Tab:
- Services this endpoint connects to as a client
- Outbound connections
- Servers accessed
- Traffic consumed per service
- Common for workstations and application servers
Services (as Server) Tab:
- Services this endpoint provides to others
- Inbound connections
- Clients served
- Traffic delivered per service
- Common for servers and infrastructure
Geographic Distribution Tab:
- Countries this endpoint communicates with
- World map visualization (if available)
- Traffic volume per country
- Identify international traffic patterns
Time Series Tab:
- Traffic over time chart
- Sent vs received breakdown
- Identify usage patterns
- Spot anomalies
Recent Flows Table:
- Latest individual flows
- Peer IP addresses
- Services used
- Traffic volume per flow
Use Cases:
- Investigate a specific server's behavior
- Troubleshoot a workstation's connectivity
- Verify firewall rules are working
- Monitor a critical device
- Identify compromised endpoints
- Baseline normal behavior
Example Analysis - Web Server:
IP: 192.168.1.80 (web-prod-01)
Country: Sri Lanka | ASN: AS12345

Traffic Summary (Last 24h):
- Sent: 1.2 TB (web content)
- Received: 45 GB (requests)
- Ratio: 26:1 (typical for web server)
- Unique Peers: 3,456 clients

Services (as Server):
- HTTPS (tcp/443): 1.1 TB | 2,345 clients
- HTTP (tcp/80): 89 GB | 1,234 clients
- SSH (tcp/22): 125 MB | 5 clients (admins)

Top Peers:
- Load Balancer (192.168.1.10): 45 GB received
- Database Server (192.168.1.50): 23 GB sent
Source Device Detail Page
Access: Click NetFlow source from NetFlow Sources card
URL Format: ?page=source&ip=192.168.62.238&period=last_6_hours
What You'll See:
Device Information:
- Device IP and hostname
- Device type (router, switch, firewall)
- Location (if configured)
- NetFlow version (v5, v9, IPFIX)
Collection Statistics:
- Total flows received
- Traffic volume seen by this device
- Sampling rate (if applicable)
- Interface count
- Last flow timestamp
Interface List:
- All monitored interfaces
- Traffic per interface
- Interface status (up/down)
- Click to view interface details
Top Flows Observed:
- Heaviest traffic passing through
- Source → Destination pairs
- Applications detected
Use Cases:
- Verify NetFlow export configuration
- Monitor collection health
- Identify which device sees which traffic
- Troubleshoot missing flow data
Interface Detail Page
Access: Click interface from Source Device detail
URL Format: ?page=interface&ip=192.168.62.238&interface=12&period=last_6_hours
What You'll See:
Interface Overview:
- Interface ID/name
- Parent device
- Ingress vs egress traffic
- Total throughput
Traffic Statistics:
- Bytes in/out
- Packets in/out
- Flow count
- Average utilization
Top Talkers on This Interface:
- Most active IPs seen
- Traffic volume per IP
- Direction (in/out)
Protocol Distribution:
- Protocols seen on this interface
- Traffic breakdown
Geographic Analysis:
- Countries communicating through this interface
- Useful for WAN links
Use Cases:
- Monitor specific WAN links
- Troubleshoot interface-level issues
- Capacity planning for interfaces
- Verify routing and traffic engineering
List Views
List views provide comprehensive, filterable tables of all entities, not just the top ones.
Conversations List
Access: Navigation menu → List Views → Conversations (or custom URL)
URL Format: ?page=list_conversations&period=last_7_days
Features:
- Pagination: Browse through all conversations (not just top 10)
- Filters:
- Search by IP address
- Minimum traffic threshold
- Sampler address (scope to specific device)
- Sorting: Sort by traffic, flows, or last seen
- Export: Export filtered data (future feature)
Columns:
- Endpoint A & B
- Countries
- Total traffic
- Flows
- Top services
- Last seen
Use Cases:
- Comprehensive conversation audit
- Find specific communication patterns
- Export for reporting
- Historical analysis
Applications List
Access: ?page=list_applications
Features:
- Complete list of all applications/protocols seen
- Filter by application name prefix
- Search functionality
- Sort by traffic, flows, clients, or servers
Columns:
- Application name
- Port number
- Service description
- Total traffic
- Total flows
- Unique clients
- Unique servers
- Last seen
Use Cases:
- Application inventory
- Identify rogue protocols
- Validate allowed applications
- Capacity planning per service
Countries List
Access: ?page=list_countries
Features:
- Geographic traffic distribution
- Filter by country name
- Sort by traffic volume
- Inbound vs outbound breakdown
Columns:
- Country (with flag)
- Inbound traffic
- Outbound traffic
- Total traffic
- Percentage of total
- Unique endpoints
Use Cases:
- Compliance monitoring (data sovereignty)
- Identify international traffic
- Geopolitical risk assessment
- DDoS source analysis
Endpoints List
Access: ?page=list_endpoints
Features:
- All endpoints (not just top talkers)
- Multiple filters:
- IP prefix search
- Protocol filter
- Country filter
- Application filter
- Minimum traffic
- Minimum flows
- Advanced sorting
Columns:
- Endpoint IP
- Hostname
- Country
- Total traffic
- Conversations
- Flows
- Role
- Last seen
Use Cases:
- Network inventory
- Find all hosts using a specific protocol
- Identify endpoints in a specific country
- Audit network activity
Protocols List
Access: ?page=list_protocols
Features:
- Protocol-level breakdown (TCP, UDP, ICMP, etc.)
- Not service-level (use Applications List for that)
- Sort by traffic or flow count
Columns:
- Protocol name
- Protocol number
- Total traffic
- Total flows
- Percentage of total
Use Cases:
- Understand L4 protocol distribution
- Monitor for unusual protocols
- Validate security policies
Sources List
Access: ?page=list_sources
Features:
- All NetFlow exporters
- Filter by sampler IP
- Health monitoring
Columns:
- Sampler IP
- Hostname
- Interface count
- Total traffic
- Flows received
- Last flow timestamp
- Status
Use Cases:
- NetFlow infrastructure monitoring
- Identify missing exporters
- Coverage verification
Time Period Selection
Accessing Period Selector
The Period Selector is located at the top of every page (globe icon with dropdown).
Available Time Periods
Recent Periods (Most Common)
- Last 5 Minutes - Real-time monitoring
- Last 15 Minutes - Real-time with short history
- Last 30 Minutes - Short-term analysis
- Last 1 Hour - Hourly monitoring
- Last 3 Hours - Short-term trends
- Last 6 Hours - Default for many views
- Last 12 Hours - Half-day analysis
- Last 24 Hours - Full day view
- Last 2 Days - Weekend comparison
- Last 7 Days - Weekly review
- Last 30 Days - Monthly analysis
- Last 90 Days - Quarterly trends
- Last 6 Months - Semi-annual
- Last 1 Year - Annual review
- Last 2 Years - Historical comparison
- Last 5 Years - Long-term trends
Specific Day Periods
- Today - Current calendar day (00:00 - now)
- Today So Far - Alias for Today
- Yesterday - Previous calendar day
- Day Before Yesterday - Two days ago
- This Day Last Week - Same weekday last week
Week Periods
- This Week - Current calendar week (Sunday - now)
- This Week So Far - Alias for This Week
- Previous Week - Last complete week
Month Periods
- This Month - Current calendar month
- This Month So Far - Alias for This Month
- Previous Month - Last complete month
Year Periods
- This Year - Current calendar year (Jan 1 - now)
- This Year So Far - Alias for This Year
- Previous Year - Last complete year
- Previous Fiscal Year - Based on fiscal calendar
Fiscal Periods
- Previous Fiscal Quarter - Company-specific quarter
How to Change Time Period
- Locate the Period Selector dropdown (top of page)
- Click to open the dropdown menu
- Scroll to find desired period
- Click to select
- Page will automatically refresh with new data
Period Behavior
- Default Period: Last 5 Minutes
- Persistence: Selected period persists across navigation
- URL Parameter: Period is stored in URL (
?period=last_6_hours) - Bookmarkable: Save URL to bookmark specific view + period
Performance Considerations
Faster Queries (< 1 second):
- Last 5 minutes to Last 24 hours
Medium Queries (1-5 seconds):
- Last 2 days to Last 30 days
Slower Queries (5-15 seconds):
- Last 90 days to Last 1 year
Very Slow Queries (15+ seconds):
- Last 2 years to Last 5 years
Tip: Use shorter periods for real-time monitoring and longer periods for trend analysis.
Data Refresh
Auto-Refresh
Enable automatic data refresh to keep your dashboard up-to-date without manual intervention.
Accessing Auto-Refresh
Located in the Period Selector (same dropdown as periods), under the "Auto-Refresh" section.
Refresh Intervals
- Manual Only (default) - No automatic refresh
- 1 Minute - Refresh every 60 seconds
- 5 Minutes - Refresh every 300 seconds
- 10 Minutes - Refresh every 600 seconds
How to Enable
- Open Period Selector dropdown
- Scroll to "Auto-Refresh" section
- Select desired interval
- Green checkmark indicates active refresh
- Timer shows countdown to next refresh
How to Disable
- Open Period Selector dropdown
- Select "Manual Only"
- Auto-refresh stops
Best Practices
- Real-Time Monitoring: Use 1-minute refresh with short periods (5-15 min)
- Dashboard Displays: Use 5-minute refresh
- Analysis Work: Disable auto-refresh to prevent interruptions
- Performance: Longer refresh intervals reduce server load
Manual Refresh
Click the Refresh button (circular arrow icon) at any time to manually reload data.
Refresh Indicator
When data is refreshing:
- Loading spinners appear in cards
- Skeleton loaders show during fetch
- Previous data remains visible (no blank screen)
Smart Caching
The application uses intelligent caching:
- Cache Duration: 2 minutes for most data
- Stale While Revalidate: Shows cached data while fetching fresh data
- Background Updates: New data fetches in background
Filtering and Searching
Global Search
Some list views include a global search box for quick filtering.
Location: Top of list view pages
Usage:
- Type IP address, hostname, or keyword
- Press Enter or click Search button
- Table filters to matching entries
- Clear search to restore full list
Search Behavior:
- Case-insensitive
- Partial matching
- Searches across all displayed columns
Filter Panel
Advanced list views include a Filter Panel for multi-criteria filtering.
Location: Collapsible panel at top of list view
Available Filters:
Endpoint Filter
- Filter by IP prefix
- Example: "192.168.1." matches all 192.168.1.x IPs
- Useful for scoping to specific subnets
Protocol Filter
- Filter by protocol name
- Example: "tcp", "udp", "icmp"
- Case-insensitive
Country Filter
- Filter by country name or code
- Example: "Sri Lanka" or "LK"
- Useful for geofencing analysis
Application Filter
- Filter by application/service prefix
- Example: "http" matches HTTP, HTTPS
- Example: "tcp/" matches all TCP services
Minimum Traffic
- Filter out low-traffic entries
- Enter bytes threshold
- Example: "1000000" = 1 MB minimum
Minimum Flows
- Filter out entries with few flows
- Enter flow count threshold
- Example: "100" = minimum 100 flows
Sampler Address Filter
- Scope to flows from specific NetFlow source
- Enter NetFlow exporter IP
- Example: "192.168.62.238"
How to Use Filters
Open Filter Panel:
- Click "Filters" or filter icon
- Panel expands with filter options
Set Filter Criteria:
- Enter values in desired filter fields
- Multiple filters combine with AND logic
- Leave fields blank to ignore that filter
Apply Filters:
- Click "Search" or "Apply" button
- Table updates with filtered results
- Filter values persist in URL
Clear Filters:
- Click "Clear" or "Reset" button
- All filters reset to defaults
- Full unfiltered list shown
Refine Filters:
- Adjust filter values
- Re-apply to narrow or broaden results
Sorting
Column Header Sorting:
- Click any column header to sort
- First click: Ascending order
- Second click: Descending order
- Third click: Remove sort (default order)
- Sort indicator (arrow) shows current sort
Sort Options (varies by view):
- Traffic (bytes)
- Flows (count)
- Recent (last seen timestamp)
- Alphabetical (IP, hostname, country)
Pagination
Pagination Controls:
- Located at bottom of tables
- Shows: "Page 1 of 45"
Page Navigation:
- First page button (|<)
- Previous page button (<)
- Page number buttons (1, 2, 3...)
- Next page button (>)
- Last page button (>|)
Page Size:
- Dropdown to select rows per page
- Options: 10, 20, 50, 100
- Default: 20 rows per page
Tip: Increase page size to reduce pagination clicks, but may slow rendering.
Navigation Guide
Navigation Patterns
Drill-Down Navigation
The module follows a drill-down pattern: Dashboard → Lists → Details
Example Flow:
- Dashboard → See "HTTPS" in Top Applications
- Click "HTTPS" → Application Detail Page
- View Top Servers → Click server IP
- Endpoint Detail Page → View Top Peers
- Click peer IP → Conversation Detail Page
Breadcrumb Navigation
Most detail pages show breadcrumbs for easy backtracking.
Example Breadcrumb:
Home > Applications > HTTPSClick "Home" to return to dashboard, or "Applications" to return to app list.
Back Button
Detail pages include a Back button (top-left) to return to previous page.
URL-Based Navigation
All pages use URL parameters for navigation. This means:
- Bookmarkable Links: Save any view as a bookmark
- Shareable URLs: Send URLs to colleagues
- Browser Navigation: Use browser back/forward buttons
- Deep Linking: Link directly to specific views
URL Structure:
/home/sipmonnetflow?page=<page>&<parameters>&period=<period>Example URLs:
Dashboard:
/home/sipmonnetflow?period=last_6_hours

Application Detail:
/home/sipmonnetflow?page=app&app=HTTPS&period=last_24_hours

Conversation Detail:
/home/sipmonnetflow?page=conversation&src=192.168.1.100&dst=203.0.113.50&period=last_6_hours

Endpoint Detail:
/home/sipmonnetflow?page=endpoint&ip=192.168.1.100&period=last_6_hours

List View:
/home/sipmonnetflow?page=list_conversations&period=last_7_days
Clickable Elements
IP Addresses
- Always clickable throughout the module
- Navigates to Endpoint Detail page
- Preserves current time period
Hostnames
- Clickable (linked to IP)
- Tooltip shows IP address on hover
- Same behavior as clicking IP
Application Names
- Clickable in Top Applications card and tables
- Navigates to Application Detail page
Country Flags
- Future feature: Click to filter by country
- Currently display-only
Conversation Rows
- Entire row clickable in conversation tables
- Navigates to Conversation Detail page
Chart Elements
- Bar chart bars are clickable (future feature)
- Pie chart slices are clickable (future feature)
Navigation Shortcuts
Period Persistence
When you navigate from one page to another, the selected time period persists automatically. No need to re-select.
Opening in New Tab
Right-click any clickable element and select "Open in new tab" to keep your current view open.
Understanding the Data
Traffic Metrics
Bytes vs Packets vs Flows
- Bytes: Actual data transferred (measures bandwidth consumption)
- Packets: Number of packets transmitted (measures packet rate)
- Flows: Number of NetFlow records (measures sessions/conversations)
Example:
Large file transfer:
- High bytes, medium packets, low flows (efficient large transfers)

Web browsing:
- Medium bytes, high packets, high flows (many small sessions)

DDoS attack:
- Low bytes, massive packets, massive flows (flooding)
Traffic Formatting
Traffic is displayed in human-readable format:
- Bytes (B): < 1,024 bytes
- Kilobytes (KB): 1,024 bytes - 1 MB
- Megabytes (MB): 1 MB - 1 GB
- Gigabytes (GB): 1 GB - 1 TB
- Terabytes (TB): 1 TB - 1 PB
- Petabytes (PB): ≥ 1 PB
Color Coding:
- 🟢 Green: < 1 GB (low traffic)
- 🔵 Blue: 1 GB - 10 GB (medium traffic)
- 🟡 Yellow: 10 GB - 100 GB (high traffic)
- 🟠 Orange: 100 GB - 1 TB (very high traffic)
- 🔴 Red: ≥ 1 TB (massive traffic)
Directional Traffic
Bidirectional Analysis
Most views show traffic in both directions:
- A → B: Traffic from A to B (outbound from A's perspective)
- B → A: Traffic from B to A (inbound to A's perspective)
- Total: Sum of both directions
Role Indicators
Source:
- Device primarily sends traffic
- Examples: Backup server, file server, streaming source
Destination:
- Device primarily receives traffic
- Examples: Web server, database server, download server
Both:
- Balanced bidirectional traffic
- Examples: Application servers, proxies, peer-to-peer
Geographic Information
Country Identification
- Based on IP geolocation databases
- Displays country name and flag
- ISO country code (e.g., "US", "LK", "GB")
ASN (Autonomous System Number)
- Identifies network operator
- Shows organization name
- Example: "AS12345 - Example ISP Corporation"
Usage:
- Identify traffic to/from cloud providers
- Detect traffic to suspicious ASNs
- Understand network topology
Hostname Enrichment
How It Works
- NetFlow contains only IP addresses
- Module queries SIPMon database for hostnames
- Displays hostname alongside IP (when available)
- Falls back to IP address if no hostname found
Hostname Display
- With hostname: Shows hostname first, IP in smaller text below
- No hostname: Shows only IP address
- Hover tooltip: Full hostname and IP on hover
Example:
With hostname:
  web-server-prod-01
  192.168.1.80

Without hostname:
  192.168.1.123
Application Classification
Service Naming
Applications are identified by:
- Service name from NetFlow (if available)
- Protocol + Port combination
- IANA port database lookup
Examples:
- HTTPS: tcp/443 with service name
- HTTP: tcp/80 with service name
- MySQL: tcp/3306
- tcp/8080: Unknown service on port 8080
- UDP (Ephemeral Ports): udp/32768-65535
Well-Known Ports
- Ports 0-1023: System ports (HTTP, HTTPS, SSH, etc.)
- Ports 1024-49151: Registered ports (MySQL, PostgreSQL, etc.)
- Ports 49152-65535: Ephemeral ports (dynamic client ports)
Time Calculations
First Seen / Last Seen
- First Seen: Earliest flow timestamp in selected period
- Last Seen: Most recent flow timestamp in selected period
- Duration: Time span between first and last seen
Note: These are relative to the selected time period, not absolute.
Throughput Calculations
- Average Bytes/Sec: Total bytes ÷ duration
- Average Flows/Sec: Total flows ÷ duration
- Average Packet Size: Total bytes ÷ total packets
TCP Flags
Flag Meanings
- SYN: Synchronize (connection start)
- ACK: Acknowledge
- FIN: Finish (graceful close)
- RST: Reset (abrupt close)
- PSH: Push (send data immediately)
- URG: Urgent
Normal Patterns
- Connection Start: SYN, SYN-ACK, ACK
- Data Transfer: ACK, PSH-ACK
- Normal Close: FIN-ACK, ACK, FIN-ACK, ACK
- Abrupt Close: RST
Abnormal Patterns
- High RST count: Connection failures or rejection
- SYN flood: Potential DDoS attack
- FIN without ACK: Incomplete close
- No SYN: Mid-session capture or fragmented data
Tips and Best Practices
Monitoring Strategy
Dashboard Monitoring
Set appropriate refresh interval:
- Real-time: 1-minute refresh
- Casual monitoring: 5-minute refresh
- Analysis: Manual only
Use appropriate time periods:
- Incident investigation: Last 5-15 minutes
- Daily monitoring: Last 1-6 hours
- Trend analysis: Last 7-30 days
Watch for anomalies:
- Sudden traffic spikes
- New applications appearing
- Unusual countries
- Missing NetFlow sources
Baseline Normal Behavior
Establish baselines:
- Note normal traffic levels (e.g., "500 GB/day typical")
- Identify expected top talkers
- Document standard applications
- Map expected geographic distribution
Schedule periodic reviews:
- Daily: Check recent events and sources
- Weekly: Review top applications and endpoints
- Monthly: Analyze trends and capacity
Create comparison views:
- Compare today vs yesterday
- Compare this week vs last week
- Compare current month vs previous month
Investigation Workflows
Troubleshooting Connectivity
- Start at Dashboard → Check global summary
- Go to Endpoint Detail for affected IP
- Check Top Peers tab → Is expected peer listed?
- Click peer → View Conversation Detail
- Check Recent Flows tab → Are flows present?
- Review TCP Flags → Any abnormal patterns?
- Check Time Series → When did issue start?
Investigating High Traffic
- Dashboard → Identify source in Top Conversations or Top Endpoints
- Click endpoint → Endpoint Detail
- Review Services (as Client) and Services (as Server)
- Identify unexpected applications or peers
- Check Top Peers → Who are they talking to?
- Use Time Series → When did high traffic start?
- Review Geographic Distribution → Is traffic going to unexpected countries?
Identifying Unauthorized Applications
- Go to Applications List (
?page=list_applications) - Sort by traffic or flows
- Review list for unknown or blocked applications
- Click suspicious application → Application Detail
- Review Top Clients → Which endpoints are using it?
- Click client → Endpoint Detail → Investigate endpoint
Detecting Data Exfiltration
- Dashboard → Check for unusual outbound traffic
- Countries List → Look for traffic to suspicious countries
- Conversations List → Sort by traffic, look for single large conversations
- Click conversation → Conversation Detail
- Check Traffic Balance → Is it mostly outbound?
- Review Protocols → Using non-standard ports?
- Check Duration → Long-lived connection?
- Review Flow Duration Distribution → Many long flows?
Performance Optimization
Query Performance
Use shorter time periods when possible
- Last 5 min to Last 24 hours: Very fast (< 1 sec)
- Last 2-7 days: Fast (1-3 sec)
- Last 30-90 days: Medium (3-10 sec)
- Last 1+ years: Slow (10-30 sec)
Use filters to reduce data:
- Filter by sampler to scope to specific device
- Use minimum traffic filter to exclude noise
- Filter by country or application to narrow focus
Navigate strategically:
- Use drill-down from dashboard (pre-filtered)
- Avoid running full list views with long periods
Browser Performance
Use pagination wisely:
- Default 20 rows/page is optimal
- Increase to 50 for fewer page changes
- Avoid 100 rows/page unless necessary (slower rendering)
Disable auto-refresh during analysis:
- Prevents interruption during investigation
- Reduces unnecessary server queries
- Re-enable when done
Close unused tabs:
- Each tab with auto-refresh makes queries
- Can overload browser and server
Data Interpretation
Understanding Flow Counts
- High flows, low bytes: Many small sessions (web browsing, API calls, port scans)
- Low flows, high bytes: Few large transfers (file transfers, backups, streaming)
- High flows, high bytes: Heavy usage across many sessions (busy server)
Traffic Patterns
- Steady traffic: Normal operations
- Spiky traffic: Batch jobs, backups, or bursty applications
- Gradual increase: Growth, potential issue developing
- Sudden spike: Investigation needed (attack, misconfiguration, or legitimate event)
Protocol Distribution
- 80-90% TCP: Normal for most networks (web, databases, file transfers)
- High UDP: Streaming, VoIP, DNS, or gaming traffic
- ICMP spikes: Network diagnostics (ping, traceroute) or potential network scan
- Unusual protocols: Investigate (could be tunneling, VPN, or unauthorized apps)
Security Best Practices
Monitoring for Threats
Port Scans:
- Look for: High flow count, low bytes, many destinations
- Card: Recent Events (may show port scan alerts)
- Action: Review Endpoint Detail of scanner
DDoS Attacks:
- Look for: Massive flows, many sources, single destination
- Card: Top Endpoints (victim will show high traffic)
- Action: Review Conversation List filtered to victim IP
Data Exfiltration:
- Look for: Large outbound traffic, unusual destinations
- Card: Top Conversations (large one-way traffic)
- Action: Review conversation detail, check duration and protocols
Malware C&C:
- Look for: Regular periodic traffic, unusual ports
- Card: Recent Events, Top Applications
- Action: Check Time Series for periodic patterns
Regular Security Checks
- Daily: Review Recent Events card
- Weekly: Check for new applications and countries
- Monthly: Review all endpoints for anomalies
- Quarterly: Analyze trends and update baselines
Reporting
Taking Screenshots
- Select desired time period
- Navigate to relevant view (dashboard, detail page, list)
- Use browser screenshot tool or system screenshot
- Include breadcrumb and period selector in screenshot for context
Exporting Data
Current Capabilities:
- Copy table data (select cells, Ctrl+C)
- Screenshot charts and tables
Future Features (planned):
- CSV export from list views
- PDF report generation
- Scheduled email reports
Creating Reports
Executive Summary:
- Screenshot Dashboard with last 30 days
- Include Global Summary metrics
- Highlight Top Applications and Endpoints
Capacity Planning:
- Use Time Series charts from key applications
- Month-over-month comparison
- Trend analysis (Last 6 months or 1 year)
Incident Reports:
- Conversation Detail screenshot
- Endpoint Detail showing anomaly
- Time Series showing when issue occurred
- Recent Flows table showing specific sessions