Monitoring Interface

Figure 1: Monitoring Interface Overview
The Monitoring interface provides the following key functions:
Real-Time Monitoring - Offers a comprehensive real-time view of collected data with flexible filtering, sorting, and search mechanisms to target specific information. Multiple display formats are available to accommodate different operational needs.
Interactive Control - Provides users with the capability to perform real-time actions on the supervision system through predefined operations, including:
- Re-scheduling checks
- Programming downtime periods for resources
- Acknowledging incidents and alerts
Host Monitoring
The host monitoring interface can be used to view the evolution of the supervision of its information system in real time.
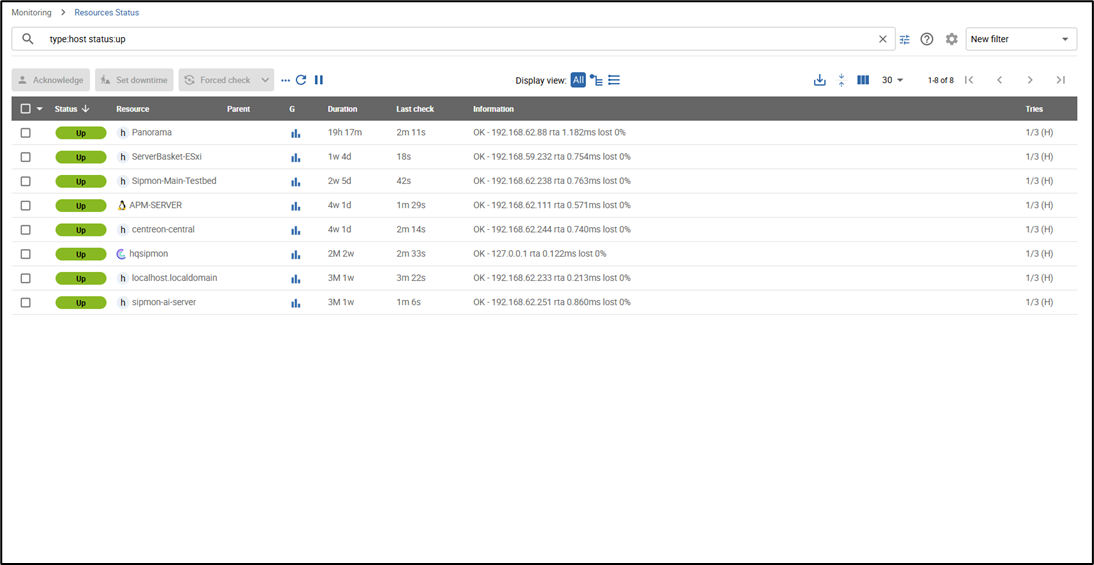
Figure 2: Host Resource Status View
Status
Statuses are indicators for the hosts or the services. Each status has a precise meaning for the object. To each status corresponds a code generated by the monitoring plugin according to thresholds defined by the user/s
Host Status
The table below summarizes all the possible statuses for a host.
| Status | Description |
|---|---|
| UP | The host is available and reachable |
| DOWN | The host is unavailable |
| UNREACHABLE | The host is unreachable |
Table 1: Host Status Indicators
Service Status
The table below summarizes all the possible statuses for a service.
| Status | Description |
|---|---|
| OK | The service presents no problem |
| WARNING | The service has reached the warning threshold |
| CRITICAL | The service has reached the critical threshold |
| UNKNOWN | The status of the service cannot be checked (e.g.: SNMP agent down, etc.) |
Table 2: Service Status Indicators
Advanced Statuses
In addition to the standard statuses, new statuses can be used to add additional information.
- The PENDING status is a status displayed for a service or a host freshly configured, but which has not yet been checked by the scheduler.
- The UNREACHABLE status is a status indicating that the host (parental relationship) is situated downstream of a host with a DOWN status.
- The FLAPPING status indicates that the status change percentage of the object is very high. This percentage is obtained from calculations performed by the network monitoring engine.
- The ACKNOWLEDGED status is a status indicating that the incident of the service or the host has been taken into account by a user.
- The DOWNTIME status is a status indicating that the incident of the service or the host occurred during a downtime period.
Soft And Hard States
A host or a service can have two states: SOFT: Signifies that an incident has just been detected and that it has to be confirmed. HARD: Signifies that the status of the incident is confirmed. Once the status is confirmed, the notification process is engaged (sending of an email, SMS, etc.).
Status Confirmation
An incident (Not-OK status) is confirmed as of the moment when the number of validation attempts has reached its end. The configuration of an object (host or service) requires a regular check interval, a number of attempts to confirm a Not-OK status and an irregular check interval. As soon as the first incident is detected, the state is “SOFT” until its confirmation into “HARD”, triggering the notification process based on the number of validation attempts defined.
Generic Actions
The following icons are available for controlling the monitoring interface:
| Icon | Action | Description |
|---|---|---|
 | Refresh | Serves to refresh the results manually. |
 | Pause | Serves to put the automatic data refreshment into pause. |
 | Restart | Serves to restart automatic data refreshment. |
Table 3: Generic Actions Available in Monitoring Interface
Hosts
Viewing Host Status
To view the status of hosts, navigate to the Monitoring tab in the main menu and select Resources Status.
Figure 3: Host Resource Status Interface
You can utilize the following filters to customize the view:
- Unhandled Problems - View hosts with problems that have not been acknowledged
- Host Problems - View all hosts experiencing issues
- All - View all hosts regardless of status
- Host Groups Summary - View hosts organized by their assigned groups

Figure 4: Host Groups Summary View

Figure 4.1: Host Groups Summary View

Figure 4.2: Host Groups Summary View
Host Table Columns
The table below provides a description of all columns displayed when viewing hosts.
| Column Name | Description |
|---|---|
| Hosts | Displays the host name. Icons indicate notification status and provide access to performance graphs. |
| Status | Shows the current operational status of the host. |
| IP Address | Indicates the assigned IP address of the host. |
| Last Check | Displays the date and time of the most recent check. |
| Duration | Shows the time period the host has maintained its current status. |
| Hard State Duration | Displays the time the host has maintained its current hard state. |
| Tries | Shows the number of validation attempts before state confirmation. |
| Status Information | Provides detailed message explaining the current host status. |
Table 4: Host Table Column Descriptions
Available Filters
The following filters are available to refine the displayed results:
- Host - Filter by host name using SQL LIKE pattern matching
- Status - Filter hosts by their current operational status
- Severity - Filter hosts based on severity level
- Poller - Display only hosts monitored by the selected poller
- Host Group - Display only hosts belonging to the selected group
Host Groups Table
The table below describes all columns available when viewing host groups.
| Column Name | Description |
|---|---|
| Host Groups | Lists all available host groups. |
| Hosts Status | Displays the count of hosts in UP, DOWN, UNREACHABLE, or PENDING status. |
| Services Status | Displays the count of services in OK, WARNING, CRITICAL, or PENDING status. |
Table 5: Host Groups Table Column Descriptions
Note: Results can be filtered by selecting a specific poller from the dropdown menu. Only hosts monitored by the selected poller will be displayed.
Host Details
When you click on a specific host, a detailed view appears displaying comprehensive information about that host.
Services
This section lists all services associated with the selected host.
Status Details
The table below summarizes the attributes available in the status details section.
| Attribute | Description |
|---|---|
| Host Status | Current operational status of the host. |
| Status Information | Detailed information about the current status. |
| Performance Data | Performance metrics associated with the check. |
| Current Attempt | Number of attempts before status validation. |
| State Type | Type of state: 'SOFT' or 'HARD'. |
| Last Check | Timestamp of the most recent check execution. |
| Next Check | Timestamp of the next scheduled check. |
| Latency | Delay in seconds between scheduled and actual check execution. |
| Execution Time | Duration of the check execution process. |
| Last State Change | Timestamp when the host status last changed. |
| Current State Duration | Duration the host has been in the current state. |
| Last Notification | Timestamp of the most recent notification sent. |
| Next Notification | Timestamp of the next scheduled notification. |
| Current Notification Number | Total count of notifications sent. |
| Is This Host Flapping? | Indicates whether the host is in a flapping state. |
| Percent State Change | Percentage of state changes occurring. |
| In Scheduled Downtime? | Indicates if the host is currently in scheduled downtime. |
| Last Update | Timestamp of the last information update. |
Table 6: Host Status Details Attributes
Available Options and Controls
The host detail view provides various options and controls to perform administrative actions on the selected host.
Links
The Links section displays all host groups associated with the selected host.
Notifications
The Notifications section shows all contacts and contact groups configured to receive notifications for this host.
Viewing To view the status of hosts, go into the menu Monitoring → Status Details→Services Grid  The grey search bar can be used to filter the result displays. You can use filters to adapt the view. To view the Services Problems but Not Acknowledged, choose Unhandled Problems in Service Status filter. To view All the Services in Non-OK status, choose Service Problems in Service Status filter. To view All the Services, choose the All in Service Status filter. • To view All Services, sort by host in any status, click on Services Grid and choose Display Details. • To view the Number of Services, sort by host and by status, click on Services Grid and choose Display Summary • To view All the Services in any status, sort by host groups, click on Services by Host group and choose Display Details • To view all the services, sort by services’ groups, click on Services by Service group and choose Display Details To view the number of services, sort by services’ groups, click on Services by Service group and choose Display Summary
Services
Viewing Service Status
To view the status of services, navigate to Monitoring → Status Details → Services Grid.
Figure 5: Services Grid Interface
The grey search bar can be used to filter the result displays. You can use filters to adapt the view:
- To view the Services Problems but Not Acknowledged, choose Unhandled Problems in Service Status filter
- To view All the Services in Non-OK status, choose Service Problems in Service Status filter
- To view All the Services, choose All in Service Status filter
View All Services Sorted by Host
To view All Services, sort by host in any status, click on Services Grid and choose Display Details.
Figure 6: Services Grid - Display Details
View Services Summary by Host
To view the Number of Services, sort by host and by status, click on Services Grid and choose Display Summary.
Figure 7: Services Grid - Display Summary
View Services by Host Group
To view All the Services in any status, sort by host groups, click on Services by Host group and choose Display Details.
Figure 8: Services by Host Group - Display Details
View Services by Service Group (Details)
To view all the services, sort by services' groups, click on Services by Service group and choose Display Details.
Figure 9: Services by Service Group - Display Details
View Services by Service Group (Summary)
To view the number of services, sort by services' groups, click on Services by Service group and choose Display Summary.
Figure 10: Services by Service Group - Display Summary
Services Table
The table below gives a description of all the columns of the table displayed when viewing services.
| Column Name | Description |
|---|---|
| Host | Displays the name of host. The icon allows to host's page details. |
| Services | Displays the name of service. The icon indicates that notifications are disabled for this service. The icon allows displaying performance graphs of the service. The icon allows to access to service's page details. |
| Duration | Displays the duration of the actual status. |
| Last Check | Displays the date and time of the last check. |
| Tries | Displays the number of attempts before status validation. |
| Status information | Displays the message explaining the status of the service. |
Table 7: Services Table Column Descriptions
Tables Of Objects Groups
The table below gives a description of all the columns of the table of services sorted by groups.
| Column Name | Description |
|---|---|
| Host or Host Groups Hosts or Service Group Hosts | Allows to display hosts or hosts linked to host groups or hosts linked to service groups. The icon allows to display all services linked to the host. The icon allows to display all performance graphs of services linked to the host. |
| Status | Displays the status of the host. |
| Services Information | Displays the status of services (details mode) or the number of services classified by status (summary mode). |
Table 8: Objects Groups Table Column Descriptions
Service Details
When you click on a service, the following screen appears.

Figure 11: Service Details Sidebar

Figure 12: Service Performance Graph
Status Details
The table below summarizes the attributes of this part.
| Attributes | Description |
|---|---|
| Service Status | Displays the status of the service. |
| Status Information | Displays the information of the status of the service. |
| Extended Status Information | Displays long output of the service. |
| Performance Data | Displays performance data associated to the check. |
| Current Attempt | Displays the number of attempts before status validation. |
| State Type | Displays the type of state ('SOFT' or 'HARD'). |
| Last Check Type | Indicates if the last type of check is 'active' or 'passive'. |
| Last Check | Displays the last check of the service. |
| Next Scheduled Active Check | Displays the next scheduled check of the service. |
| Latency | Displays the latency in seconds between the scheduled check and the real check execution. |
| Check Duration | Displays the execution time of the check. |
| Last State Change | Displays when the status of the service changed. |
| Current State Duration | Displays the date and time from which the host has been in the current state. |
| Last Service Notification | Displays the sent date and time of the last notification. |
| Current Notification Number | Displays the number of sent notifications. |
| Is This Service Flapping? | Indicates if the service is in flapping state. |
| Percent State Change | Displays the percentage change of state. |
| In Scheduled Downtime? | Indicates if the host is in scheduled downtime. |
| Last Update | Displays the date and time of the last information update. |
Table 9: Service Status Details Attributes
Options and Controls Available
Options and controls allow you to perform a number of actions on the host.
Detailed Graph and Status Graph
The Detailed Graph and Status Graph allow to display performance graphs and the history of chart statuses for this service.
Host Shortcuts
The host shortcuts are the same as those from host’s details page.
Service Shortcut
Have here direct action to the service.
Configure Service
Allows to access to service's configuration page.
View Logs for Service
Allows to display services' event logs.
View Report for Service
Allows to display services' availability reporting.
Links
The links container allows to display The groups of hosts which this service is linked to. The groups of services which this service is linked to. The categories of services which this service is linked to.
Notifications
The Notifications container allows to display the contacts and contact groups linked to the host who will receive notifications.
Monitoring Engine
This part allows to display information about monitoring scheduling queue, comments or downtimes of objects.
Downtime
To visualize downtimes, navigate to Monitoring → Downtimes → Downtimes.

Figure 13: Downtime Management Interface
The table below gives a description of all the columns.
| Column Name | Description |
|---|---|
| Host Name | Indicates the name of host. |
| Services | Indicates the name of service. |
| Start Time and End Time | Displays the start and end date and time. |
| Duration | Displays the duration of the downtime. |
| Author | Displays the name of user who set the downtime. |
| Comments | Displays the comments linked to the downtime. |
| Started | Indicates if the downtime is started or not. |
| Fixed | Indicates if the start and end date time if fixed or not. |
Table 10: Downtime Table Column Descriptions
Available Filters
You can filter the results presented via the following filters:
- Host - Can be used to filter by name of host via an SQL LIKE type search
- Service - Can be used to filter by name of service via an SQL LIKE type search
- Output - Can be used to filter by output of services
- Author - Can be used to filter by author
- Display Finished Downtime - Allows to display recurring finished downtime
- Display Downtime Cycle - Allows to display recurring downtime
Comments
To view comments, go to the menu Monitoring → Downtimes → Downtimes.
Figure 14: Comments Management Interface
The table below gives a description of all the columns.
Available Filters
You can filter the results presented via the following filters:
- Host - Can be used to filter by name of host via an SQL LIKE pattern matching
- Service - Can be used to filter by name of service via an SQL LIKE pattern matching
- Output - Can be used to filter by service output